Category: Financial.

By Richard Oxford

With all of the market history, Internet Stock Guru’s, and other information available, the average investor still underperforms when compared to the market.

They are investing emotionally rather that logically (without emotion).

Let’s address causes and potential solutions.

What is Emotional Intelligence?‍

Emotional intelligence (EI) represents the ability to understand and manage one’s own feelings and emotions. Emotionally intelligent people excel at managing relationships with others and making favorable decisions under pressure. Emotional Intelligence in investment is the ability to make logical decisions while avoiding emotion driven mistakes. These would include decisions driven by fear, greed or jealousy.

In 1990, psychologists John Mayer and Peter Salovey of Yale theorized that a unitary intelligence underlay those other skill sets. They coined the term, emotional intelligence, which they broke down into four “branches”:

  • Identifying emotions on a nonverbal level
  • Using emotions to guide cognitive thinking
  • Understanding the information emotions convey and the actions emotions generate
  • Regulating one’s own emotions, for personal benefit and for the common good(1)

How Do We Unpack This?

So what does that mean to you as an investor?  I’m sure that you understand the words, but what is the effect on your self-managed portfolio?

  1. Self-investors tend to buy too early and for the wrong reason!
  2. Private Investors tend to buy because someone else bought and has done well!
  3. People investing their own money tend to hold stocks longer than they should and ignore market signals.
  4. Investors can be emotionally attached to their decisions.

Let’s address each of these.

Buying Early

In the early 2000’s, after the crash, my own father bought Petsmart stock.  His reasoning to me was that it had been up to $30/share 6 months earlier and it was a sure thing.  My response is that there could be a reason for the drop, but he was adamant.  The stock went to $2 or so and hovered, forever. He bought too early, he bought for the wrong reason.

Follow the Leader

Face it folks, you are playing into large investors hands when you buy because they bought. People like Warren Buffet are successful because they share their purchases well after the fact.  Then followers buy the stock driving the price up.  Besides, do you think Buffet pays retail? No, most of his transactions are private sales at a significant discount.  He beat you twice.

Holding too Long

Investors tend to be extremely greedy. Market moves tend to have signals.  Competent investment managers watch for the signals of a change in direction.  Individuals generally do not!  The thinking is when the market has a direction it will continue forever.  I made 20% last year; I’ll make 20% this year.  They ride the wave to the point it crashes and then they ride it down past where they should have taken their lumps.  The old saying, “Pigs get fed and hogs get slaughtered” applies here.

Emotional Attachment

Let’s face it folks, nobody likes to be wrong.  Whereas many an Investment Advisor will drop a bad decision like a hot rock, individual investors tend to convince themselves that their decisions were correct and hold too long. It’s sort of a fight or flight syndrome in the stay or exit decision.

Equities buying should be a totally clinical analysis of the potential ROI on the purchase based on fundamental or technical.  (Good companies/products are not always good stocks.) Liking the product is not prerequisite to purchasing the stock (i.e. Blackberry).

Possible Solution

“However researchers have recently uncovered some hard numbers. Their findings? Americans reach retirement with approximately 15% more money and report feeling more at ease about their financial lives — all by simply working with a financial advisor. Additionally, 79% of those who consult a financial advisor describe feeling confident in achieving their retirement goals.(2)

These truths carry through in your personal accounts and self-managed IRA as well as 402(k) type accounts.  You are better off finding a competent Investment Advisor and you will be wealthier later in life and probably at death. They have no emotional attachments.

“PLAN EARLY AND PLAN OFTEN!”™


Credits

Have you ever heard of the Setting Every Community Up for Retirement Enhancement Act, better known as the “SECURE Act” affecting your 2020 tax return?  Well, you might want to pay attention because it is now law and probably affects you!

This is another round of interesting changes to the U.S. 2020 tax code. The rules regarding Required Minimum Distributions (RMDs) have changed. For those that do not know, these rules dictate when and how much people must withdraw from their retirement accounts to avoid tax penalties.  Beginning Jan. 1, 2020, the new law moves back the age at which you must begin withdrawing money from your qualified retirement accounts from age 70 ½ to 72.  If you turn 70 ½ in 2019, you will still need to take your RMD for 2019, no later than April 1 of 2020.  If you are currently receiving RMDs (or should be) because you are already over age 70 ½, you must continue to take RMDs.  Only those who turn 70 ½ in 2020 (or later) may wait until age 72 to take their Required Minimum Distributions. So, for people who turned 70 ½ in 2019, there is no change.

Beginning with the 2020 tax year, the law will allow you to contribute to your traditional IRA in the year you turn 70 ½ and beyond, provided you have earned income.  You still may not make 2019 (prior year) traditional IRA contributions if you are over 70 ½.  This plays well for both business owners and those who work past 70.

Upon the death of the account owner, distributions to individual beneficiaries must now be made within 10 years.  This is a big change from allowing them to take it over their lifetime (a.k.a. stretch). There are exceptions for spouses, disabled individuals, and individuals not more than 10 years younger than the account owner.  Minor children who are beneficiaries of IRA accounts also have a special exception to the 10-year rule, but only until they reach the age of majority.

The new law also allows penalty-free withdrawals from retirement plans for birth or adoption expenses up to certain limits. The new rule allows each parent to use the $5,000 exemption, which means a couple could take up to $10,000 out penalty-free if they each had separate retirement accounts. While new parents can opt to repay the withdrawal amount, this is not a loan and does not need to adhere to the 401(k) repayment rules.

“PLAN EARLY AND PLAN OFTEN!”™

Over the past few months, I’ve been listening to clients, laypersons and politicians talking about how well the economy has done because of deregulation and tax cuts.  While I believe that taxes needed to come down and there were some cases of over-regulation, I’ve been a skeptic of tactic and results.  As a skeptic, I thought that I ought to research a bit of this myself.

Three things came to mind as constant sources of bragging rights.  Gross Domestic Product, Employment and the stock market.  Looking for some quality charting on the subject is not hard.  The Bureau of Labor Statistics, BLS, puts out labor analysis at least annually. The Bureau of Economic Analysis has charts on GDP quite regularly.

Why charts?  Charts depict trend and I believe that we’ve been in a long-term trend that cannot be credited to tax cuts or deregulation.  If tax cuts were fueling growth in any of the above the charts would display the rate of change in an upward steepening of the slope.

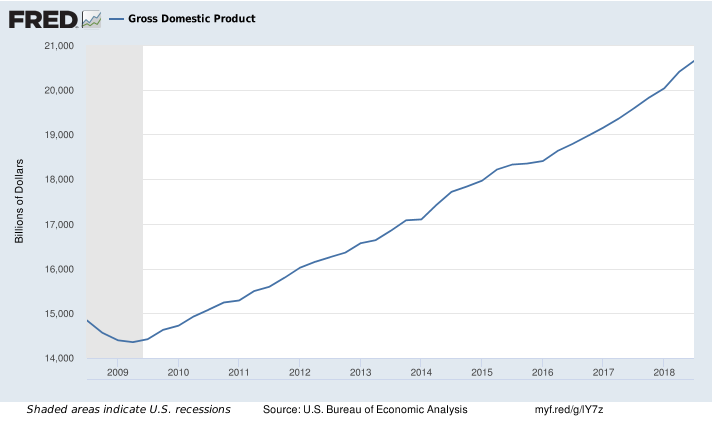
The first graph is a BEA chart of the GDP from 2008 to present.  Note that just a bit after 2009 marks the beginning of the Obama presidency, just after 2017 marks the end of Obama and beginning of Trump’s presidency.  If a tax cut was driving productivity we should see a change.  What we’re looking at is a continuation of the trend.

FRED Graph

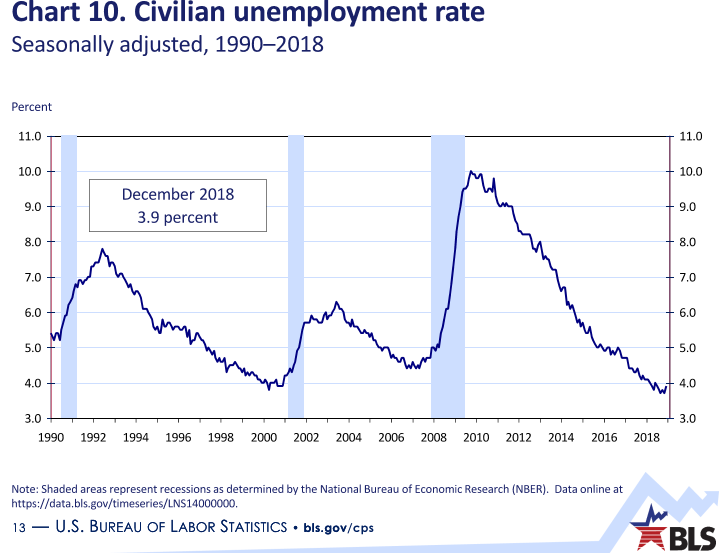
Moving on to employment, I’ve pulled two current charts.  The first is simply the US Civilian unemployment rate from 1990 to 2019. The last three recessions are marked in light blue.  Note that unemployment bottoms and starts increasing just before a recession.  Since a recession is defined as an economic decline that is identified by two successive quarters of decline in the GDP, it only makes sense that we have a couple of quarters in an uptick in employment prior to the recession being declared.  My bigger point is that between 2010 and today, the negative slope of unemployment has not changed much.  Here are some BIS charts (BLS employment Charts)

CivGraph

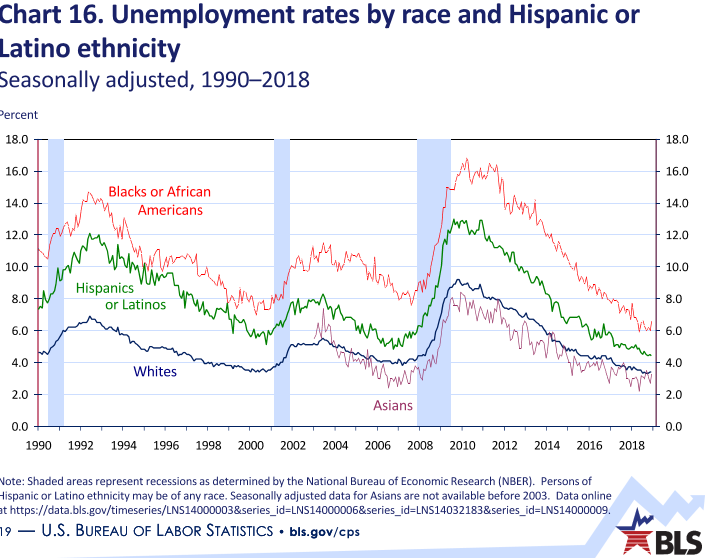
The same goes for Unemployment by ethnicity:

EthnicGraph

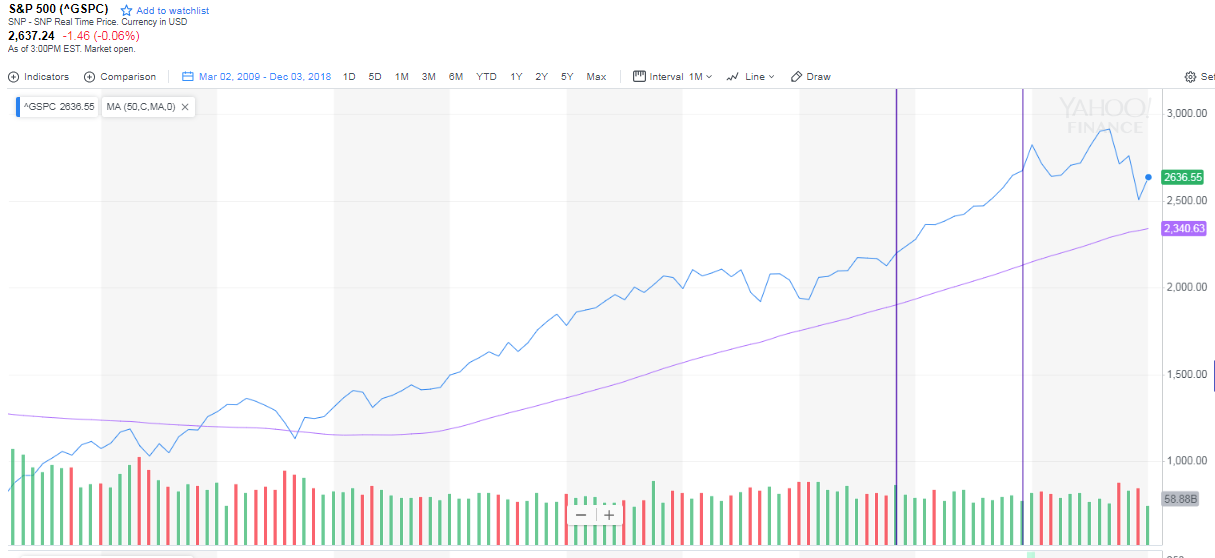
Now, let’s compare market performance based upon the S&P 500 index to the aforementioned charts. Here are some things that I believe are of note.  The chart begins essentially the beginning of the Obama years and shows a steady rise through the election in November of 2016 (1st vertical bar).  From President Trump’s election, we continue a nice steady rise to the next vertical bar in December of 2017 and on until the first of 2018.  That marks the passage of the Tax Cut and Jobs Act of 2017. 

S&P today

Many years ago, I heard a quote or statement that presidents get way too much credit and way too much blame. But, things they do can affect us and our retirement accounts.  Look at the right side of the last graph (in fact, all graphs).  After the tax cut, stocks are down.  Neither the GDP growth rate nor the employment growth rate seems to have changed from their positive slopes.

Many believed that a big corporate tax cut would make us more competitive in the world.  My contention is that we have always been competitive.  Unless we alienate buyers from us and send them to other sellers, we’ll always be competitive.  This unfortunate lesson might be unfolding in the soybean industry right now.

I contend that the timing of the cut was ill-timed.  We were sub-5% unemployment and growing our GDP.  That hasn’t changed.  That sort of cut would have been better in 2009 when we were in a recession and had a 10% unemployment rate.  The money hasn’t gone toward hiring new employees, bring part-time employees to full-time or much corporate infrastructure.  The money has gone to stock buybacks which prop up corporate share values of officers, board members, and major shareholders.  As I was wrapping this piece up, I saw a Fortune article that confirmed my opinions.  https://finance.yahoo.com/news/why-trump-apos-1-5-120826303.html

Ronald Reagan cut taxes twice but increased them 11 times.  Most agree that the 1981 cuts helped pull us out of a recession that began under Carter.  In other words, a well-timed stimulus.

I’m sure we will be waiting several years to determine if the 2017 Act will perform as advertised.

10/09/2018

WiserAdvisor announces that Richard Oxford of Richard Oxford Financial has been awarded admittance as a member of its directory of financial advisors.

Financial advisors are granted admission into WiserAdvisor (www.wiseradvisor.com) based on their credentials and qualifications. All members offer their services to investors with a fee rather than solely with commissions, allowing them to assist investors with a variety of different investment options. All members are also properly registered with the SEC, FINRA or other regulatory organizations.

Since 2003, WiserAdvisor has focused on taking much of the guesswork out of finding a qualified financial advisor or financial planner. This is done both through the stringent admittance guidelines, as well as through the information provided to investors about each member advisor. All members must complete an extensive profile outlining their services, qualifications, and credentials, including their educational background. 

Because of the strict standards that a financial professional must meet in order to become a member, WiserAdvisor only admits a select few high-quality financial advisors and financial planners. More than 600,000 professionals can provide insurance and financial advice. Less than 1% have been granted membership into WiserAdvisor. 

Thousands of investors use WiserAdvisor each year to find local financial advisors and planners and trust that WiserAdvisor will help them find the right professionals to meet their unique needs.

About WiserAdvisor.com

WiserAdvisor is an online service that connects investors to local financial advisors and financial planners. It is an independent and free service provided to investors, allowing them to find local professionals who can help them build their portfolios, plan for retirement, manage their estates, or to help them with other investment issues. More information about WiserAdvisor and its services can be found at www.wiseradvisor.com.

About Richard Oxford Financial

Richard Oxford is a financial advisor located in Scottsdale, AZ.
More information about Richard can be found at http://www.wiseradvisor.com/advisor_profile_state~id~1885741.asp and at www.richardoxfordfinancial.com


Stacking investment returns against index performance is an inherently flawed approach to benchmarking. The forward-thinking innovators at Flexible Plan Investments give clients a more realistic way to assess performance.


Founder and President of Flexible Plan Investments Jerry Wagner posed two questions:

  1. Do you care about risk?
  2. Are you investing to reach a goal?

If the answer to both is yes, then it isn’t sensible, he says, to use the Standard & Poor’s 500 or any other index as a benchmark of success. First, regarding risk, the S&P 500 was no stranger to steep market declines in the last decade. And when it plummets 50 percent or more, which it has done twice in recent history, it’s not an index one wants to be mirroring.

“Return is important, but you can’t ignore risk,” says Wagner. “Think about a lottery ticket. Your return can be almost infinite, but your risk is almost 100 percent. You always have to view potential performance in terms of relative risk.”

Second, if you’re investing to reach a goal, which most investors are, then does it make sense to gauge your success against an index that isn’t relevant to that goal?

“The definition of true benchmarking is whether or not you’re on target to reach your goal, not whether you measure up to an arbitrary index,” says Wagner.

OnTarget Investing: Customized Benchmarks

Defining realistic goals and setting appropriate benchmarks is the premise behind the OnTarget Investing system at Flexible Plan Investments, a nearly four-decade-old active investment management firm that holds more than $2 billion in assets under management.

Based on financial goals and time horizons dictated by the client at the onset of the investing relationship, the firm produces regular, color-coded charts that show clients where their portfolio stands in relation to their long-term goals.

The key here is long term. Subjecting oneself to the unfair expectations of short-term results can lead to emotional, knee-jerk decisions. In a perfect world, Wagner says, investors would be encouraged to only review returns once a year, not even quarterly. Reason being, true market highs and lows are only fully known in hindsight, and often results cannot be properly evaluated in quarterly—much less daily—snapshots.

“If you’re measuring against an index, most investors get overly confident at market tops and overly discouraged at market bottoms,” he says. “But when they can evaluate their progress based on a simple chart that tells them whether or not they’re on target to meet their specified goal, it’s easier to sleep at night.”

My firm, Richard Oxford Financial, works with Flexible Plan and offers the OnTarget Investing program to clients.

“Plan Early and Plan Often!”™

As Seen In Bloomberg Businessweek, Fortune & Money

The information provided is intended to be general in nature and should not be construed as investment advice from Flexible Plan Investments Ltd., Richard Oxford Financial or Dutch Asset Corporation.  Inherent in any investment is the potential for loss as well as the potential for gain. Prior to investing, read and understand the risk considerations in our Brochure Form ADV.

I met with a potential client this week and realized that we were speaking a different language.  This isn’t the first time that I’ve seen the confusion on investment terms.  I’ve always tried to be careful to not devolve into “Work Speak”.  Work Speak is that alphabet soup of acronyms and terms that all professionals share among themselves.  Outsiders do not normally understand and sometimes we need to step back and use explanations.

Here are a few terms that I find myself explaining on a regular basis.  As you can see above, in my community, we’ve got thousands!

  1. A fiduciary is obligated to act in the best interest of their client and avoid any conflicts. They cannot make a recommendation based simply upon higher compensation.
  2. Investment Advisor Representative (IAR). This acronym refers to people who work for investment advisory companies and provide investment-related advice.  They are regulated by either their state or the Securities Exchange Commission (SEC), registered by the states in which they do business, required to act as fiduciaries to their clients, are compensated with fees, and must work through a Registered Investment Advisor (RIA) firm.
  3. Registered Representative (RR). This acronym refers to individuals working for a brokerage company and conducts transaction-based (commission) services for their clients. They are regulated by FINRA, registered to a sponsoring firm (Broker), not required to act as a fiduciary (but may), compensated with commissions from client transactions.
  4. Registered Investment Advisor (RIA). This is a financial firm that has registered with the SEC or state authorities. By law, RIAs have a fiduciary duty toward their clients.  This means they have a fundamental obligation to provide suitable investment advice and always act in their client’s best interest.
  5. Fees are the charge incurred for investment advisory services.  Fees are typically a flat percentage based upon total assets managed.
  6. Commissions are a transaction-based charge for services rendered during securities and insurance transactions.  In a securities or variable annuity transaction, the commission usually reduces the total number of shares/units purchased.  In a fixed insurance transaction (fixed life or annuity), the commission is paid by the insurance company and does not reduce the money paid into the policy.
  7. Risks are typically the quantification of the chance that an investment outcome will not be as expected.
    1. Interest rate risk is the possibility that interest rates will rise during a holding period and drive down the value of the security.
    2. Market Risk is the chance of a decline in investment value because of a development that affects the entire market. Think Tsunami, a plane crashing into a building, etc.
    3. Sector Risk is a similar risk that affects a specific sector of the market. Think Soybean tariffs.
    4. Company Risk is the chance that bad governance, poor decisions, declining earnings or other factors drive down the equity value.
    5. Credit Risk is the risk that a company or government entity will issue a bond or note that they cannot pay. Think of Italy, Greece, Brazil, or Venezuela.
    6. Inflation risk is the potential loss of purchasing power because your investments do not keep up with inflation.
    7. Reinvestment risk is the possibility that at the time for reinvestment, you cannot secure a similar rate of return on your investment. Think: Selling a 5% bond and only able to buy a 4% bond at the time of reinvestment.
  8. Risk Tolerance is your ability to withstand negative market swings in order to get the highest overall long-term return. Typically, the higher your required return, the higher the necessary risk tolerance.
  9. Securities are fungible (tradable with similar assets), negotiable financial instruments that represent some type of financial value. They are often in the forms of stocks, bonds or options.

If you have an unusual one, try to stump me.  Send me a note and I’ll try to help.  You can find more terms scattered throughout here.

“Plan Early and Plan Often!”™

You may not realize that the very first teacher pensioner for the state of Arizona was in 1912.  There were no deposits, or requirements other than having worked 30 years as a teacher.  I wonder how far that $50 / month went in 1912.

It appears this continued (at $50/mo) until 1943 when the Legislature created the Teachers’ Retirement System.  I wonder how far $50 went in 1943.  This is when teachers began contributing a portion of their salary with a variable employer contribution rate. This pension merger with the Arizona State Retirement System (ASRS) 10 years later.

The ASRS was created to provide benefits to state employees as well as for political subdivisions that agreed to sign on.  This included the state university system and some of the smaller colleges.  Today, all of the full-time state employees, school districts, community college districts, state universities, counties and most of the cities and towns are a signatory to the ASRS.

Fortunately for participates, the ASRS has been well run to this point. Some of this has been good fiscal stewardship, some has been continuous increases in contribution rates.  In 1943, the maximum employer contribution was 5%, last year it was 11.34% and this year 11.8% (effective July 1, 2018).

As a Financial Advisor, one thing that I do know is you need to plan for all contingencies.  During the “Not-So-Great Recession” (I may need to © that), we saw the following results from very well-funded pensions. Here is a little piece of a longer article “The Great Recession and Public Pensions” by Tyler Bond.

  • Florida drops from 101.4% funded to 84.1% funded
  • New York drops from 101.5% funded to 94.3% funded
  • Oregon drops from 112.2% funded all the way down to 80.2% funded

This was a during a two-year market retrenchment.  As of June 30th, 2017, Arizona was only funded for 70.5% of its liabilities. Arizona’s fund dropped from $25B to $17B in the last recession.  That’s a 32% drawdown.

I also know something else important.  In the almost 11 years since her early retirement, my wife has never had a pension increase.  Furthermore, her share of the cost of insurance has gone up several times.

Never think that your access to your defined benefit plan (pension) is locked in stone.  It has changed

several times over the last 106 years and will likely change again.  My fear is that it will not be to your benefit.

“Plan Early and Plan Often!”™

A Story of 403b v. 457

People who work in the public non-profit sectors may have a choice in the Defined Contribution Plan (403b or 457)from their employer.  We’re often asked which is better or what makes the most sense for me and my family.  Like most things in the financial world, “It depends!”

Defined Contribution plans come in many flavors.  But, for public employees, it basically boils down to 403(b) Plans, 457(b) Plans (both shortened herein). Federal employees have access to Thrift Savings Plans (TSP). I’m going to explain the features and benefits of each of the first two plans and save TSP for a separate article.

A 403b plan is typically offered to government employees, employees of privately owned nonprofit businesses and churches. This would include government employees at almost any level including public school employees. Like the well-known 401k, 403b plans are a type of “defined-contribution plan”. All of these plans allow employees to shelter money on a tax-deferred basis for retirement. You put untaxed money into the plan and it grows “tax-deferred” until withdrawal. These plans became law in 1958. Originally known as tax-sheltered annuities (TSA) or tax-deferred annuities (TDA) plans, they could only be invested in annuity contracts at that time. These plans are most commonly used by educational institutions.  I can remember my mother-in-law having those as late as the 70’s.

457b plans are offered to state and local government employees and are a form of deferred compensation.  In other words, you defer your current compensation to a future date.  In addition, you can invest the deferred compensation and grow it tax-deferred until you withdraw at a future date.

Both plans have two types of deferral:

  • Non-Elective Contributions are contributions made by the employer in the employee’s name.
  • Elective Deferrals are contributions determined by the employee and withheld from their paycheck.

PROS

  • Both plans offer deferral of current taxes and tax-deferred growth
  • 403b plans have a maximum employee contribution of $18,500 for 2018
  • 403b plans can have additional matching funds added by the employer raising the aggregate total to $55,000/year in 2018
  • 457 plans have a maximum total contribution of $18,500 for 2018
  • Both plans have Catch-up provisions for people over 50.  Allowing an additional $6,000/year
  • 457 plans are not ERISA governed plans and have no early withdrawal penalty
  • 457 plan allows for a double catch-up ($12k/yr.) for people who have under contributed over the life of their plan
  • Many 403b plans have loan provisions. The maximum under the law is $50,000 or ½ of your account (whichever is less)

CONS

  • 403b plans have a 10% tax penalty for pre- 59 ½ distributions (in most cases)
  • Both plans require a minimum distribution (RMD) each year after the year you attain 70 ½ years of age. The percentage of distribution goes up each year after that.
  • You must take your RMD whether you want to or not
  • Not taking RMD subjects you to a 50% tax penalty on the amount you did not withdraw. OUCH!!
  • RMDs can subject you to the extra taxation of Social Security Benefits
  • You may have limited investment choices (more later)
  • Withdrawals are treated as ordinary income when much of the growth is actually capital gains

SUMMARY

All of this is informational and not an attempt to dissuade anyone from joining a plan.  These plans are probably the best any of us will see for saving toward retirement.  As I said earlier, the plan you pick will depend upon many things, including Marital Status, age, health, prior savings, future plans (ie: financial plan), spouses access to a plan, intended retirement age, part-time work in retirement and more.

Your employer may offer both plans.  But, inside each plan is a host of offerings from various annuities to brokerage plans.  Each of these plans has their own pros and cons.  Wading through this muck often requires professional advice.

“Plan Early and Plan Often!”™

The IRS just gave guidance that a “nondeductible” IRA may still be converted into a Roth IRA.  We have had our concerns that the new tax codes might have changed the IRS interpretation.

Until 1997, taxpayers over a certain level of income were no longer able to deduct their IRA contribution.  Many advisors thought that the rule was that the higher income earner could not open an IRA, which was incorrect. Note, that they were still able to make the contribution but simply lost the ability to deduct them.

Why would anyone open an IRA that they could not deduct?  Well, it still allowed tax-deferred growth after it was opened. It was a “tax-deferred annuity” that could be invested in any way that an IRA could be invested.  With the creation of a Roth IRA (1997) and the Roth conversion rules that developed afterward, the planning community spared no time in putting two and two together. Now we could convert the “excess” IRA contribution that had never been deducted into a Roth IRA. The future growth would be “tax-free” instead of “tax differed”.  Some refer to this as a “Back-Door Roth”. This allowed a way for Roth contribution for people who would previously not have been allowed to contribute.

With some of the changes in the new tax code, the planning community wondered if that ability had been forfeited.  The ruling came down in favor of allowing that to continue.

So, at least that part of the planning race is over until 2025!

The changes to the tax code have left bits and pieces like this for clarification that will take years to decipher.  Even grander in scope are new sections of the code like 199A, and new terms of art like “QBI” (Qualified Business Income) that will need to be further defined.  That endeavor will take so much time that several years of business returns will be filled without reliable guidance, so battles over letter audits will likely continue until 2025 and after.  Then, it all sunsets and goes away. We are back to the 2017 tax code. Right about the time we actually understand what we’re doing and reframe our business tax practices.

What should the Trump tax code be nicknamed?  “Finish Line 2025”!  Or, “The Constant Confusion of the American Taxpayer Act”.

So, if you have never used a tax planning firm in the past and have just used tax preparation firms, you may want to rethink that. If you need proof, consider that H&R Block just announced the closing of 400 offices and their stock has dropped significantly in value as a result.

“Plan Early and Plan Often!”™

Let’s say, you’re already contributing the maximum amount to your 401(k) and you’re wondering what else you could possibly do to save for a comfortable future or even early retirement?  What are your retirement options? Depending on your situation, there are several options.  Some are driven by your taxable income and others are not.

Retirement Option One:

The common option is a ROTH IRA.  But, that isn’t really new.  People have known about ROTHs for years.  This is a type of qualified savings account in which you deposit “after-tax” money, it grows tax-free and you are not taxed upon withdrawal.  Unlike your 401(k) or IRA (and others), you are never “required” to withdraw. You can also withdraw your basis prior to age 59 ½ with no penalty.  This is greatly simplified but covers the basics of a ROTH account.

Running the calculations to their conclusion, let’s say that a 40-year old put $500/month into a Roth until age 65 and earned 7% on the investment.  That would be 300 payments of $500 for a total of $150,000.  A couple of clicks on the old financial calculator and we find that this account would hold $405,000!  That’s absolutely awesome!

Most people become more conservative when they retire.  So, let’s assume a 5% ROI after age 65.  Also, this saver wants to start reaping the rewards of their 25-year savings plan by taking $30,000 in tax-free income from the account.  Nothing abnormal with this.  How long until the account spends to zero? This account carries to age 87 or a total of 22 years.

What happens after that?  They take a $30k/year pay cut! The account is exhausted.

Another Retirement Option:

What if there were another type of account that acted in a similar way, but with other benefits? Imagine depositing the same amount into this new account for the same period and actually having about 44% more tax-free income? Imagine that while this happens your account is subject to much lower risk!

Looking at the first ROTH account, can you imagine that if 2007/9 hit 2 years before you retired?  To recap that period:

  • The SPY (a good S&P measurement) peaked on 10/15/07 at 157.52
  • 17 months later, it bottomed at 67.73
  • Total loss, if you pulled out at the bottom, 57.13% OUCH!!
  • The SPY next passed 157 on 4/15/13
  • Your recovery time was just over 4 years

Assuming you bought and held, your $500k account would now be worth $214,989. There are other ways to grow the money without taking on that potential for loss.  There may be other potential benefits for you as well.  As they are very specific to you as an individual, I’m not going to go into that discussion in a broad forum like this.

Each of these options has a utility based upon the needs of the individual.  Each is a tool and some are better while others are worse.

Is the right tool in here?

The thing about tools is that you should always choose the right tool for the job! Contact us is you have any questions.

Remember:

“Plan Early and Plan Often!”™

/* ]]> */