
Over the past few months, I’ve been listening to clients, laypersons and politicians talking about how well the economy has done because of deregulation and tax cuts. While I believe that taxes needed to come down and there were some cases of over-regulation, I’ve been a skeptic of tactic and results. As a skeptic, I thought that I ought to research a bit of this myself.
Three things came to mind as constant sources of bragging rights. Gross Domestic Product, Employment and the stock market. Looking for some quality charting on the subject is not hard. The Bureau of Labor Statistics, BLS, puts out labor analysis at least annually. The Bureau of Economic Analysis has charts on GDP quite regularly.
Why charts? Charts depict trend and I believe that we’ve been in a long-term trend that cannot be credited to tax cuts or deregulation. If tax cuts were fueling growth in any of the above the charts would display the rate of change in an upward steepening of the slope.
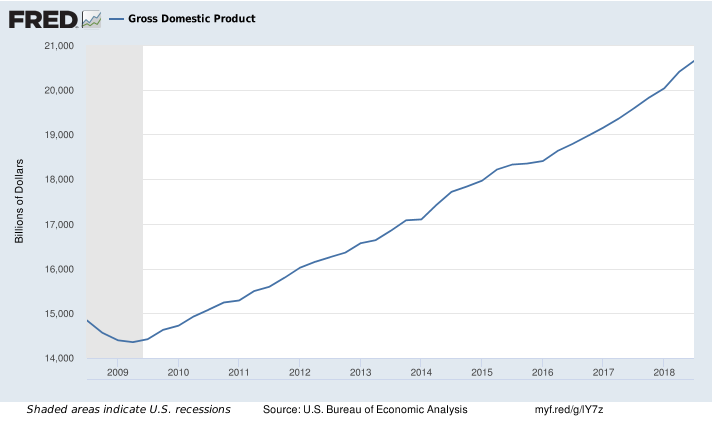
The first graph is a BEA chart of the GDP from 2008 to present. Note that just a bit after 2009 marks the beginning of the Obama presidency, just after 2017 marks the end of Obama and beginning of Trump’s presidency. If a tax cut was driving productivity we should see a change. What we’re looking at is a continuation of the trend.
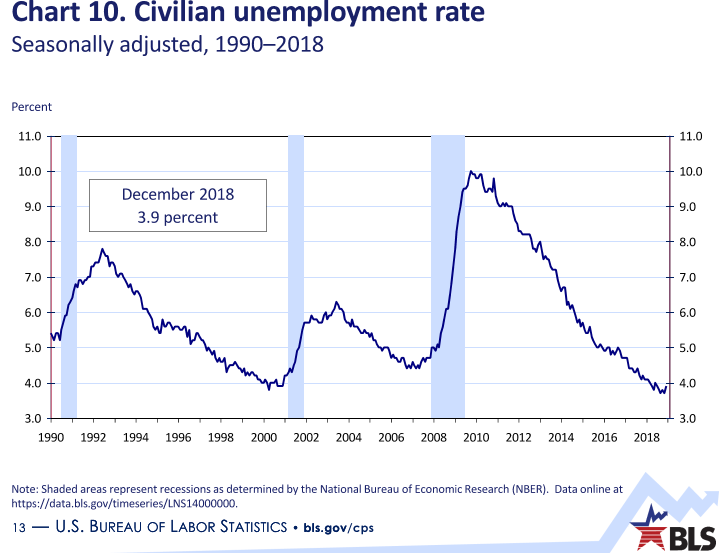
Moving on to employment, I’ve pulled two current charts. The first is simply the US Civilian unemployment rate from 1990 to 2019. The last three recessions are marked in light blue. Note that unemployment bottoms and starts increasing just before a recession. Since a recession is defined as an economic decline that is identified by two successive quarters of decline in the GDP, it only makes sense that we have a couple of quarters in an uptick in employment prior to the recession being declared. My bigger point is that between 2010 and today, the negative slope of unemployment has not changed much. Here are some BIS charts (BLS employment Charts)
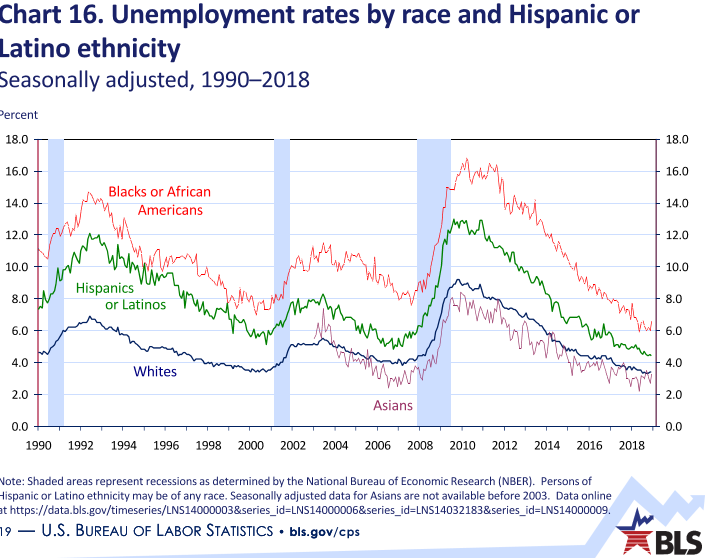
The same goes for Unemployment by ethnicity:
Now, let’s compare market performance based upon the S&P 500 index to the aforementioned charts. Here are some things that I believe are of note. The chart begins essentially the beginning of the Obama years and shows a steady rise through the election in November of 2016 (1st vertical bar). From President Trump’s election, we continue a nice steady rise to the next vertical bar in December of 2017 and on until the first of 2018. That marks the passage of the Tax Cut and Jobs Act of 2017.
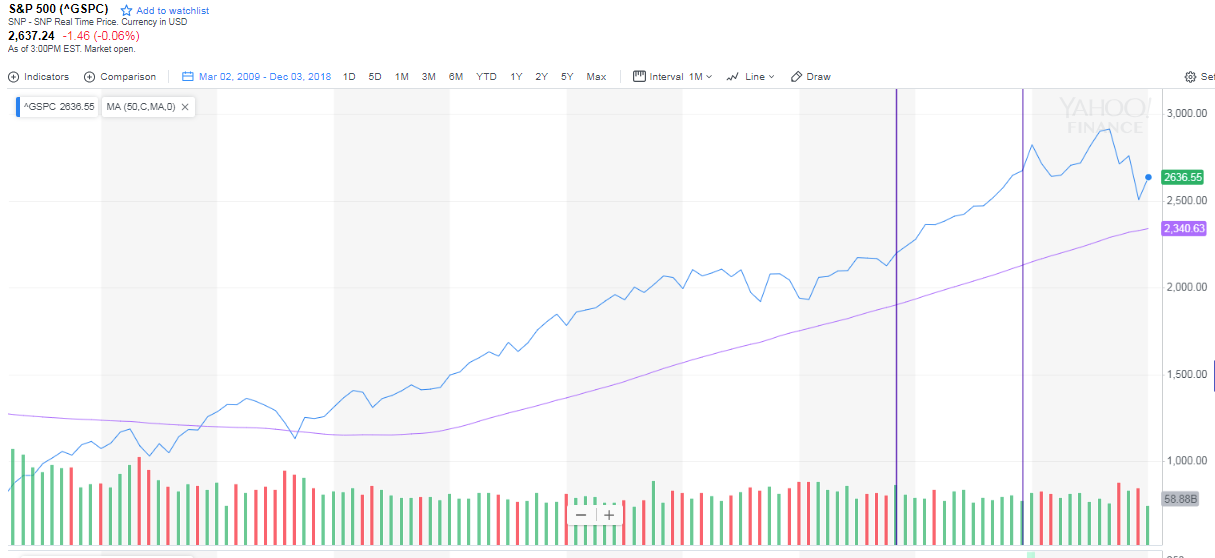
Many years ago, I heard a quote or statement that presidents get way too much credit and way too much blame. But, things they do can affect us and our retirement accounts. Look at the right side of the last graph (in fact, all graphs). After the tax cut, stocks are down. Neither the GDP growth rate nor the employment growth rate seems to have changed from their positive slopes.
Many believed that a big corporate tax cut would make us more competitive in the world. My contention is that we have always been competitive. Unless we alienate buyers from us and send them to other sellers, we’ll always be competitive. This unfortunate lesson might be unfolding in the soybean industry right now.
I contend that the timing of the cut was ill-timed. We were sub-5% unemployment and growing our GDP. That hasn’t changed. That sort of cut would have been better in 2009 when we were in a recession and had a 10% unemployment rate. The money hasn’t gone toward hiring new employees, bring part-time employees to full-time or much corporate infrastructure. The money has gone to stock buybacks which prop up corporate share values of officers, board members, and major shareholders. As I was wrapping this piece up, I saw a Fortune article that confirmed my opinions. https://finance.yahoo.com/news/why-trump-apos-1-5-120826303.html
Ronald Reagan cut taxes twice but increased them 11 times. Most agree that the 1981 cuts helped pull us out of a recession that began under Carter. In other words, a well-timed stimulus.
I’m sure we will be waiting several years to determine if the 2017 Act will perform as advertised.