Bear Market/Recession
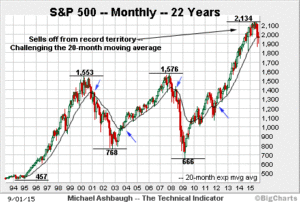
A bear market is considered to be a time when the S&P falls at least 20% before it begins to recover. Because the market is constantly ranging in a several percentage point range, the start of the decline and recovery are difficult to pinpoint at the time. They are very easy to see in hindsight. On the other hand, recessions are two consecutive quarters of declining GDP.
As you can see from the last two bear markets, market volatility makes it difficult to pick tops and bottoms in real time.
Since The Great Depression, September 1929-June 1932, we have had 14 bear markets. The average duration of those was 17.0 months with an average time between of 49 months. The average decline was 36% and the average time to break even was 43.2 months. I’m seeing The Great Depression as an outlier that would significantly skew the math. That bear market lasted 33 months, had an 86.7% decline and took 25 years to recover. In fact, we had 4 other recessions before the market recovered to the 1929 level. Ouch!
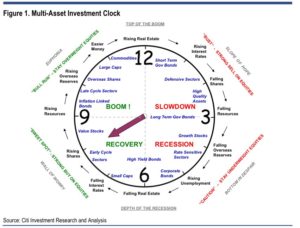
Why should you care? Unless you want to be doomed to repeat the mistakes of your ancestors, you need to change your behavior. Markets work in cycles. Whatever titles someone chooses to use, the cycle looks like this:
This chart alone shows a strong need for active management. Passive managers would have you believe that buy and hold works for everyone. I can tell you why it doesn’t. First, individual investors are emotional about their money. Who cares more about your money than you? This drives them to make mistakes. The second reason is that no single person has an unlimited timeframe until they need the money. If so, I would say split between the SPX and the QQQ’s and ride the storm.
Investor Psychology
The unfortunate reality is that investors’ fears get the best of them and they sell at the wrong time. Then as the market recovers, greed takes over and they buy at the wrong time. They hear the news, see the market and believe it should go on forever. The classic example is my “former” barber and client who I could not convince to not buy gold when it was at $1900 in 2011. Try as I might, logic didn’t overcome greed. He believed he would miss out on a fortune. This is typical investor psychology.
Look at the second chart again and ask yourself where you believe we are in the cycle? We’ve obviously moved out of the “Easy Money” phase and toward “Raising Interest Rates”. Does that portend a recession? Remember what I said earlier. It’s nearly impossible to pinpoint the top or bottom while living through them. Depending upon how you count, we’re about 113 months into this bull market. Remember the average is 49 months.
Does this put us in Market Correction territory? I know what I think. Tell me what you think!
Always remember, there are Advisors who actively manage the cycle!


