August 2018.

Bear Market/Recession

A bear market is considered to be a time when the S&P falls at least 20% before it begins to recover. Because the market is constantly ranging in a several percentage point range, the start of the decline and recovery are difficult to pinpoint at the time. They are very easy to see in hindsight.  On the other hand, recessions are two consecutive quarters of declining GDP.

Shown here are charts on the last two bear markets which happened to also be recessions.

The Last Two Bear Markets!

As you can see from the last two bear markets, market volatility makes it difficult to pick tops and bottoms in real time.

Since The Great Depression, September 1929-June 1932, we have had 14 bear markets.  The average duration of those was 17.0 months with an average time between of 49 months.  The average decline was 36% and the average time to break even was 43.2 months.  I’m seeing The Great Depression as an outlier that would significantly skew the math.  That bear market lasted 33 months, had an 86.7% decline and took 25 years to recover. In fact, we had 4 other recessions before the market recovered to the 1929 level.  Ouch!

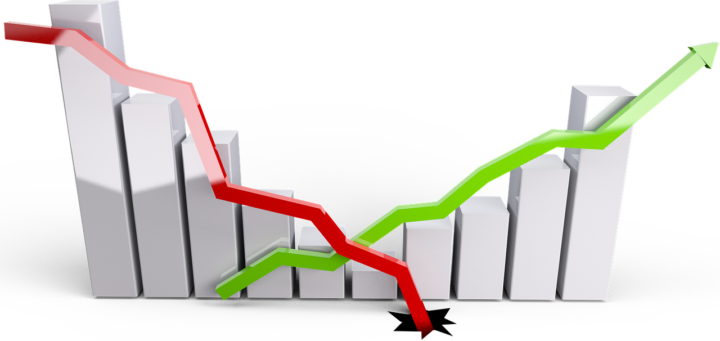
Why should you care? Unless you want to be doomed to repeat the mistakes of your ancestors, you need to change your behavior.  Markets work in cycles. Whatever titles someone chooses to use, the cycle looks like this:

This chart alone shows a strong need for active management.  Passive managers would have you believe that buy and hold works for everyone.  I can tell you why it doesn’t. First, individual investors are emotional about their money.  Who cares more about your money than you?  This drives them to make mistakes.  The second reason is that no single person has an unlimited timeframe until they need the money.  If so, I would say split between the SPX and the QQQ’s and ride the storm.

Investor Psychology

The unfortunate reality is that investors’ fears get the best of them and they sell at the wrong time.  Then as the market recovers, greed takes over and they buy at the wrong time.  They hear the news, see the market and believe it should go on forever.   The classic example is my “former” barber and client who I could not convince to not buy gold when it was at $1900 in 2011.  Try as I might, logic didn’t overcome greed. He believed he would miss out on a fortune. This is typical investor psychology.
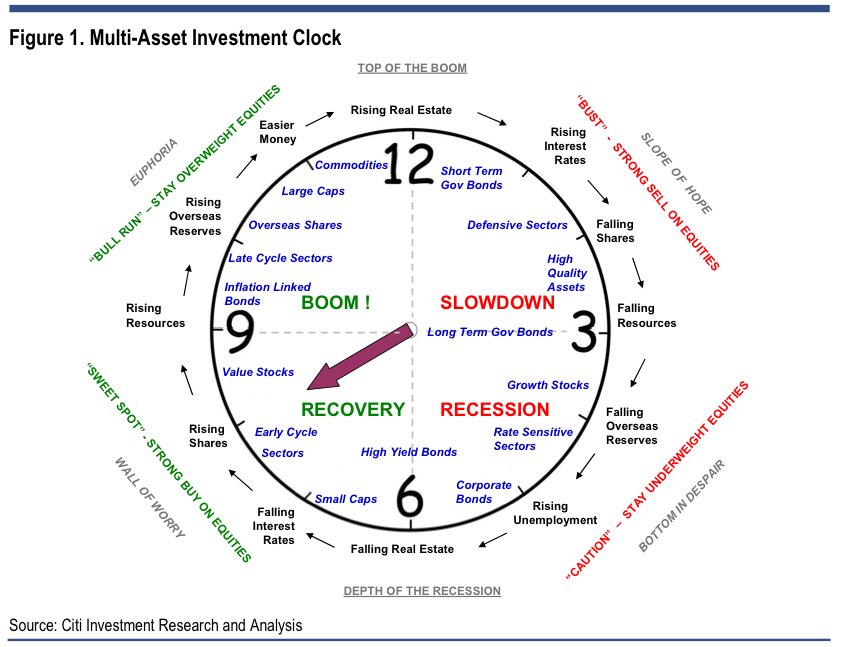
This is a graphic representation of a full market cycle.

Market Cycle Clock

Look at the second chart again and ask yourself where you believe we are in the cycle? We’ve obviously moved out of the “Easy Money” phase and toward “Raising Interest Rates”.  Does that portend a recession? Remember what I said earlier.  It’s nearly impossible to pinpoint the top or bottom while living through them.  Depending upon how you count, we’re about 113 months into this bull market.  Remember the average is 49 months.

Does this put us in Market Correction territory?  I know what I think.  Tell me what you think!

Always remember, there are Advisors who actively manage the cycle!

“Plan Early and Plan Often!”™

I met with a potential client this week and realized that we were speaking a different language.  This isn’t the first time that I’ve seen the confusion on investment terms.  I’ve always tried to be careful to not devolve into “Work Speak”.  Work Speak is that alphabet soup of acronyms and terms that all professionals share among themselves.  Outsiders do not normally understand and sometimes we need to step back and use explanations.

Here are a few terms that I find myself explaining on a regular basis.  As you can see above, in my community, we’ve got thousands!

  1. A fiduciary is obligated to act in the best interest of their client and avoid any conflicts. They cannot make a recommendation based simply upon higher compensation.
  2. Investment Advisor Representative (IAR). This acronym refers to people who work for investment advisory companies and provide investment-related advice.  They are regulated by either their state or the Securities Exchange Commission (SEC), registered by the states in which they do business, required to act as fiduciaries to their clients, are compensated with fees, and must work through a Registered Investment Advisor (RIA) firm.
  3. Registered Representative (RR). This acronym refers to individuals working for a brokerage company and conducts transaction-based (commission) services for their clients. They are regulated by FINRA, registered to a sponsoring firm (Broker), not required to act as a fiduciary (but may), compensated with commissions from client transactions.
  4. Registered Investment Advisor (RIA). This is a financial firm that has registered with the SEC or state authorities. By law, RIAs have a fiduciary duty toward their clients.  This means they have a fundamental obligation to provide suitable investment advice and always act in their client’s best interest.
  5. Fees are the charge incurred for investment advisory services.  Fees are typically a flat percentage based upon total assets managed.
  6. Commissions are a transaction-based charge for services rendered during securities and insurance transactions.  In a securities or variable annuity transaction, the commission usually reduces the total number of shares/units purchased.  In a fixed insurance transaction (fixed life or annuity), the commission is paid by the insurance company and does not reduce the money paid into the policy.
  7. Risks are typically the quantification of the chance that an investment outcome will not be as expected.
    1. Interest rate risk is the possibility that interest rates will rise during a holding period and drive down the value of the security.
    2. Market Risk is the chance of a decline in investment value because of a development that affects the entire market. Think Tsunami, a plane crashing into a building, etc.
    3. Sector Risk is a similar risk that affects a specific sector of the market. Think Soybean tariffs.
    4. Company Risk is the chance that bad governance, poor decisions, declining earnings or other factors drive down the equity value.
    5. Credit Risk is the risk that a company or government entity will issue a bond or note that they cannot pay. Think of Italy, Greece, Brazil, or Venezuela.
    6. Inflation risk is the potential loss of purchasing power because your investments do not keep up with inflation.
    7. Reinvestment risk is the possibility that at the time for reinvestment, you cannot secure a similar rate of return on your investment. Think: Selling a 5% bond and only able to buy a 4% bond at the time of reinvestment.
  8. Risk Tolerance is your ability to withstand negative market swings in order to get the highest overall long-term return. Typically, the higher your required return, the higher the necessary risk tolerance.
  9. Securities are fungible (tradable with similar assets), negotiable financial instruments that represent some type of financial value. They are often in the forms of stocks, bonds or options.

If you have an unusual one, try to stump me.  Send me a note and I’ll try to help.  You can find more terms scattered throughout here.

“Plan Early and Plan Often!”™

You may not realize that the very first teacher pensioner for the state of Arizona was in 1912.  There were no deposits, or requirements other than having worked 30 years as a teacher.  I wonder how far that $50 / month went in 1912.

It appears this continued (at $50/mo) until 1943 when the Legislature created the Teachers’ Retirement System.  I wonder how far $50 went in 1943.  This is when teachers began contributing a portion of their salary with a variable employer contribution rate. This pension merger with the Arizona State Retirement System (ASRS) 10 years later.

The ASRS was created to provide benefits to state employees as well as for political subdivisions that agreed to sign on.  This included the state university system and some of the smaller colleges.  Today, all of the full-time state employees, school districts, community college districts, state universities, counties and most of the cities and towns are a signatory to the ASRS.

Fortunately for participates, the ASRS has been well run to this point. Some of this has been good fiscal stewardship, some has been continuous increases in contribution rates.  In 1943, the maximum employer contribution was 5%, last year it was 11.34% and this year 11.8% (effective July 1, 2018).

As a Financial Advisor, one thing that I do know is you need to plan for all contingencies.  During the “Not-So-Great Recession” (I may need to © that), we saw the following results from very well-funded pensions. Here is a little piece of a longer article “The Great Recession and Public Pensions” by Tyler Bond.

  • Florida drops from 101.4% funded to 84.1% funded
  • New York drops from 101.5% funded to 94.3% funded
  • Oregon drops from 112.2% funded all the way down to 80.2% funded

This was a during a two-year market retrenchment.  As of June 30th, 2017, Arizona was only funded for 70.5% of its liabilities. Arizona’s fund dropped from $25B to $17B in the last recession.  That’s a 32% drawdown.

I also know something else important.  In the almost 11 years since her early retirement, my wife has never had a pension increase.  Furthermore, her share of the cost of insurance has gone up several times.

Never think that your access to your defined benefit plan (pension) is locked in stone.  It has changed

several times over the last 106 years and will likely change again.  My fear is that it will not be to your benefit.

“Plan Early and Plan Often!”™

/* ]]> */