Category: Investing.

By Richard Oxford

With all of the market history, Internet Stock Guru’s, and other information available, the average investor still underperforms when compared to the market.

They are investing emotionally rather that logically (without emotion).

Let’s address causes and potential solutions.

What is Emotional Intelligence?‍

Emotional intelligence (EI) represents the ability to understand and manage one’s own feelings and emotions. Emotionally intelligent people excel at managing relationships with others and making favorable decisions under pressure. Emotional Intelligence in investment is the ability to make logical decisions while avoiding emotion driven mistakes. These would include decisions driven by fear, greed or jealousy.

In 1990, psychologists John Mayer and Peter Salovey of Yale theorized that a unitary intelligence underlay those other skill sets. They coined the term, emotional intelligence, which they broke down into four “branches”:

  • Identifying emotions on a nonverbal level
  • Using emotions to guide cognitive thinking
  • Understanding the information emotions convey and the actions emotions generate
  • Regulating one’s own emotions, for personal benefit and for the common good(1)

How Do We Unpack This?

So what does that mean to you as an investor?  I’m sure that you understand the words, but what is the effect on your self-managed portfolio?

  1. Self-investors tend to buy too early and for the wrong reason!
  2. Private Investors tend to buy because someone else bought and has done well!
  3. People investing their own money tend to hold stocks longer than they should and ignore market signals.
  4. Investors can be emotionally attached to their decisions.

Let’s address each of these.

Buying Early

In the early 2000’s, after the crash, my own father bought Petsmart stock.  His reasoning to me was that it had been up to $30/share 6 months earlier and it was a sure thing.  My response is that there could be a reason for the drop, but he was adamant.  The stock went to $2 or so and hovered, forever. He bought too early, he bought for the wrong reason.

Follow the Leader

Face it folks, you are playing into large investors hands when you buy because they bought. People like Warren Buffet are successful because they share their purchases well after the fact.  Then followers buy the stock driving the price up.  Besides, do you think Buffet pays retail? No, most of his transactions are private sales at a significant discount.  He beat you twice.

Holding too Long

Investors tend to be extremely greedy. Market moves tend to have signals.  Competent investment managers watch for the signals of a change in direction.  Individuals generally do not!  The thinking is when the market has a direction it will continue forever.  I made 20% last year; I’ll make 20% this year.  They ride the wave to the point it crashes and then they ride it down past where they should have taken their lumps.  The old saying, “Pigs get fed and hogs get slaughtered” applies here.

Emotional Attachment

Let’s face it folks, nobody likes to be wrong.  Whereas many an Investment Advisor will drop a bad decision like a hot rock, individual investors tend to convince themselves that their decisions were correct and hold too long. It’s sort of a fight or flight syndrome in the stay or exit decision.

Equities buying should be a totally clinical analysis of the potential ROI on the purchase based on fundamental or technical.  (Good companies/products are not always good stocks.) Liking the product is not prerequisite to purchasing the stock (i.e. Blackberry).

Possible Solution

“However researchers have recently uncovered some hard numbers. Their findings? Americans reach retirement with approximately 15% more money and report feeling more at ease about their financial lives — all by simply working with a financial advisor. Additionally, 79% of those who consult a financial advisor describe feeling confident in achieving their retirement goals.(2)

These truths carry through in your personal accounts and self-managed IRA as well as 402(k) type accounts.  You are better off finding a competent Investment Advisor and you will be wealthier later in life and probably at death. They have no emotional attachments.

“PLAN EARLY AND PLAN OFTEN!”™


Credits

Over the past few months, I’ve been listening to clients, laypersons and politicians talking about how well the economy has done because of deregulation and tax cuts.  While I believe that taxes needed to come down and there were some cases of over-regulation, I’ve been a skeptic of tactic and results.  As a skeptic, I thought that I ought to research a bit of this myself.

Three things came to mind as constant sources of bragging rights.  Gross Domestic Product, Employment and the stock market.  Looking for some quality charting on the subject is not hard.  The Bureau of Labor Statistics, BLS, puts out labor analysis at least annually. The Bureau of Economic Analysis has charts on GDP quite regularly.

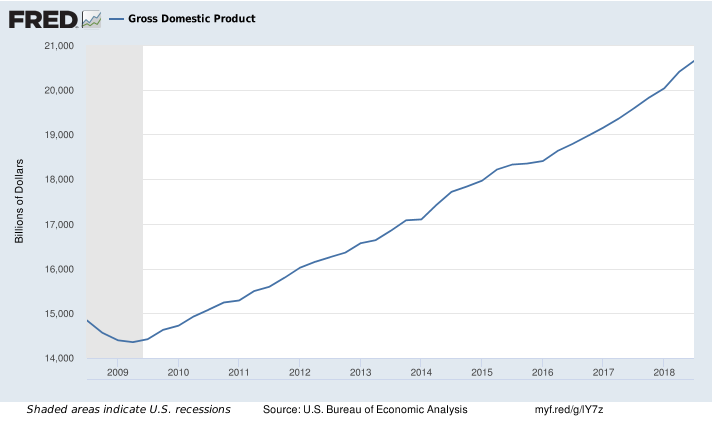
Why charts?  Charts depict trend and I believe that we’ve been in a long-term trend that cannot be credited to tax cuts or deregulation.  If tax cuts were fueling growth in any of the above the charts would display the rate of change in an upward steepening of the slope.

The first graph is a BEA chart of the GDP from 2008 to present.  Note that just a bit after 2009 marks the beginning of the Obama presidency, just after 2017 marks the end of Obama and beginning of Trump’s presidency.  If a tax cut was driving productivity we should see a change.  What we’re looking at is a continuation of the trend.

FRED Graph

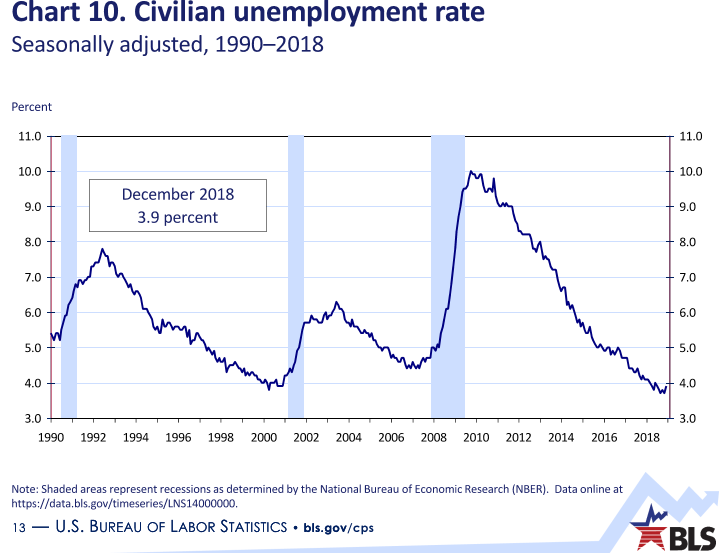
Moving on to employment, I’ve pulled two current charts.  The first is simply the US Civilian unemployment rate from 1990 to 2019. The last three recessions are marked in light blue.  Note that unemployment bottoms and starts increasing just before a recession.  Since a recession is defined as an economic decline that is identified by two successive quarters of decline in the GDP, it only makes sense that we have a couple of quarters in an uptick in employment prior to the recession being declared.  My bigger point is that between 2010 and today, the negative slope of unemployment has not changed much.  Here are some BIS charts (BLS employment Charts)

CivGraph

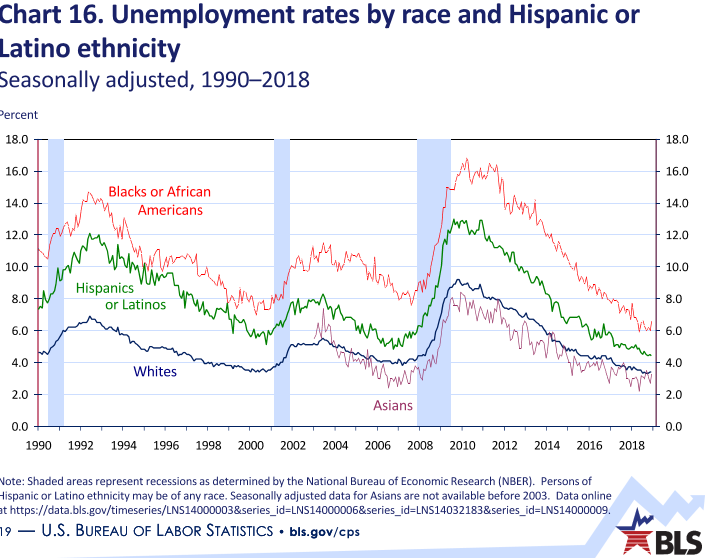
The same goes for Unemployment by ethnicity:

EthnicGraph

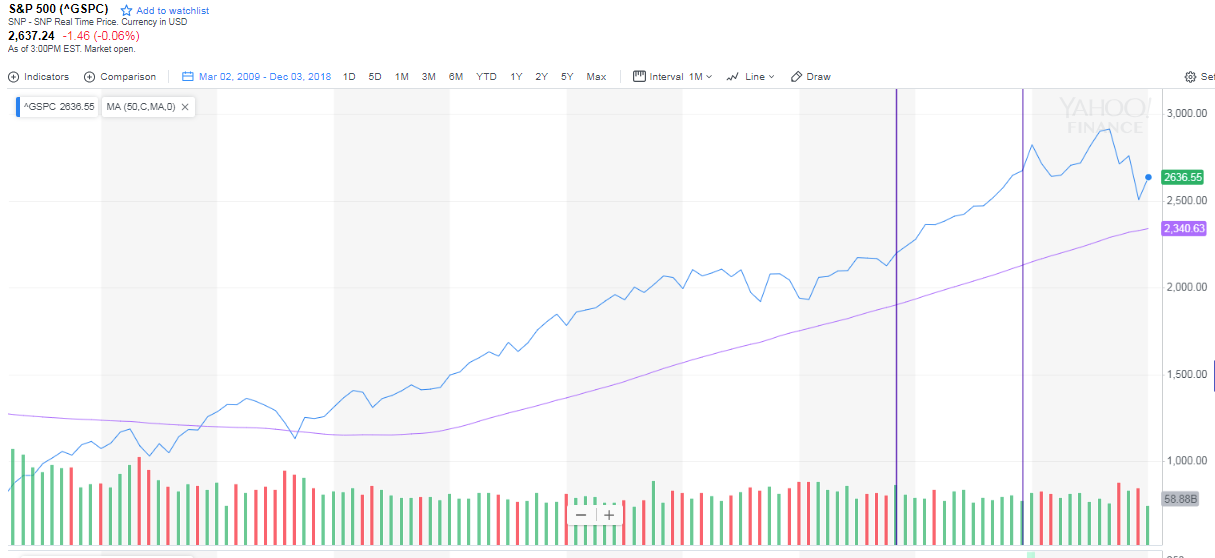
Now, let’s compare market performance based upon the S&P 500 index to the aforementioned charts. Here are some things that I believe are of note.  The chart begins essentially the beginning of the Obama years and shows a steady rise through the election in November of 2016 (1st vertical bar).  From President Trump’s election, we continue a nice steady rise to the next vertical bar in December of 2017 and on until the first of 2018.  That marks the passage of the Tax Cut and Jobs Act of 2017. 

S&P today

Many years ago, I heard a quote or statement that presidents get way too much credit and way too much blame. But, things they do can affect us and our retirement accounts.  Look at the right side of the last graph (in fact, all graphs).  After the tax cut, stocks are down.  Neither the GDP growth rate nor the employment growth rate seems to have changed from their positive slopes.

Many believed that a big corporate tax cut would make us more competitive in the world.  My contention is that we have always been competitive.  Unless we alienate buyers from us and send them to other sellers, we’ll always be competitive.  This unfortunate lesson might be unfolding in the soybean industry right now.

I contend that the timing of the cut was ill-timed.  We were sub-5% unemployment and growing our GDP.  That hasn’t changed.  That sort of cut would have been better in 2009 when we were in a recession and had a 10% unemployment rate.  The money hasn’t gone toward hiring new employees, bring part-time employees to full-time or much corporate infrastructure.  The money has gone to stock buybacks which prop up corporate share values of officers, board members, and major shareholders.  As I was wrapping this piece up, I saw a Fortune article that confirmed my opinions.  https://finance.yahoo.com/news/why-trump-apos-1-5-120826303.html

Ronald Reagan cut taxes twice but increased them 11 times.  Most agree that the 1981 cuts helped pull us out of a recession that began under Carter.  In other words, a well-timed stimulus.

I’m sure we will be waiting several years to determine if the 2017 Act will perform as advertised.

Stacking investment returns against index performance is an inherently flawed approach to benchmarking. The forward-thinking innovators at Flexible Plan Investments give clients a more realistic way to assess performance.


Founder and President of Flexible Plan Investments Jerry Wagner posed two questions:

  1. Do you care about risk?
  2. Are you investing to reach a goal?

If the answer to both is yes, then it isn’t sensible, he says, to use the Standard & Poor’s 500 or any other index as a benchmark of success. First, regarding risk, the S&P 500 was no stranger to steep market declines in the last decade. And when it plummets 50 percent or more, which it has done twice in recent history, it’s not an index one wants to be mirroring.

“Return is important, but you can’t ignore risk,” says Wagner. “Think about a lottery ticket. Your return can be almost infinite, but your risk is almost 100 percent. You always have to view potential performance in terms of relative risk.”

Second, if you’re investing to reach a goal, which most investors are, then does it make sense to gauge your success against an index that isn’t relevant to that goal?

“The definition of true benchmarking is whether or not you’re on target to reach your goal, not whether you measure up to an arbitrary index,” says Wagner.

OnTarget Investing: Customized Benchmarks

Defining realistic goals and setting appropriate benchmarks is the premise behind the OnTarget Investing system at Flexible Plan Investments, a nearly four-decade-old active investment management firm that holds more than $2 billion in assets under management.

Based on financial goals and time horizons dictated by the client at the onset of the investing relationship, the firm produces regular, color-coded charts that show clients where their portfolio stands in relation to their long-term goals.

The key here is long term. Subjecting oneself to the unfair expectations of short-term results can lead to emotional, knee-jerk decisions. In a perfect world, Wagner says, investors would be encouraged to only review returns once a year, not even quarterly. Reason being, true market highs and lows are only fully known in hindsight, and often results cannot be properly evaluated in quarterly—much less daily—snapshots.

“If you’re measuring against an index, most investors get overly confident at market tops and overly discouraged at market bottoms,” he says. “But when they can evaluate their progress based on a simple chart that tells them whether or not they’re on target to meet their specified goal, it’s easier to sleep at night.”

My firm, Richard Oxford Financial, works with Flexible Plan and offers the OnTarget Investing program to clients.

“Plan Early and Plan Often!”™

As Seen In Bloomberg Businessweek, Fortune & Money

The information provided is intended to be general in nature and should not be construed as investment advice from Flexible Plan Investments Ltd., Richard Oxford Financial or Dutch Asset Corporation.  Inherent in any investment is the potential for loss as well as the potential for gain. Prior to investing, read and understand the risk considerations in our Brochure Form ADV.

/* ]]> */